# Clear R environment:
rm(list = ls())

# Load some R packages:
library(dplyr)
library(stringr)
library(stringi)
library(kableExtra) # For presenting table.
library(haven)
library(rmarkdown)Introduction
Vietnam Household Living Standards Survey (VHLSS) is a nationwide-survey conducted by the General Statistics Office (GSO) to evaluate living standards for policy-making and socioeconomic development planning.
From 2002 to 2010, this survey has been conducted regularly by the GSO every two years. From 2011 to 2020, VHLSS are conducted annually. However, the odd-numbered year surveys only collect data on demographics, employment and income.
This document outlines the process of data cleaning and preparation to construct a Panel dataset for further research projects.
Understanding the data
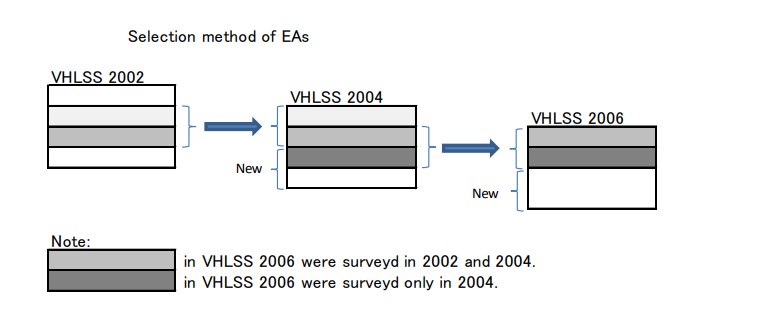
How VHLSS is sampled
At the household level, each year, GSO with re-select 50% of surveyed households from previous year and the other 50% are newly selected. In other words, if in 2014, GSO surveyed 1,000 households, then in 2018, 500 from those will be re-selected for survey. GSO will select 500 new households for 2018 survey.
Data Cleaning
Importing libraries
Defining functions for data pre-processing
In order to join VHLSS datasets from different years, we need to create hcode variable to join matching households. To do this, I will concatenate tinh, huyen, xa, diaban, hoso to create a 16-digit series.
add_zero <- function(var_name, n_max) {

  tibble(x_text = as.character(var_name)) %>%
    mutate(n_digits = str_count(x_text),
           delta = n_max - n_digits,
           pre = strrep("0", times = delta),
           full_code = str_c(pre, x_text)) %>%
    pull(full_code) %>%
    return()
}

create_hcode <- function(data, year) {
  data %>%
    mutate(tinh_n = add_zero(tinh, 2),
           huyen_n = add_zero(huyen, 3),
           xa_n = add_zero(xa, 5),
           diaban_n = add_zero(diaban, 3),
           hoso_n = add_zero(hoso, 3)) %>%
    mutate(h_code = str_c(tinh_n, huyen_n, xa_n, diaban_n, hoso_n)) %>%
    mutate(year = year) %>%
    select(-c(tinh_n, huyen_n, xa_n, diaban_n, hoso_n)) %>%
    return()
}
Constructing h_code from HO1.dta files
# HO1.dta:
read_dta("./VHLSS2018/HO1.dta") -> ho1_2018
read_dta("./VHLSS2016/Ho1.dta") -> ho1_2016
read_dta("./VHLSS2014/Ho1.dta") -> ho1_2014
read_dta("./VHLSS2012/ho11.dta") -> ho1_2012
read_dta("./VHLSS2010/ho11.dta") -> ho1_2010

ho1_2018 %>%
  create_hcode(2018) %>%
  mutate(h_code16 = str_c(add_zero(tinh16, 2),
                          add_zero(huyen16, 3),
                          add_zero(xa16, 5),
                          add_zero(diaban16, 3),
                          add_zero(hoso16, 3))) -> ho1_2018

ho1_2016 %>%
  create_hcode(2016) %>%
  mutate(h_code14 = str_c(add_zero(tinh14, 2),
                          add_zero(huyen14, 3),
                          add_zero(xa14, 5),
                          add_zero(diaban14, 3),
                          add_zero(hoso14, 3))) -> ho1_2016

ho1_2014 %>%
  create_hcode(2014) %>%
  mutate(h_code12 = str_c(add_zero(tinh12, 2),
                          add_zero(huyen12, 3),
                          add_zero(xa12, 5),
                          add_zero(diaban12, 3),
                          add_zero(hoso12, 3))) -> ho1_2014

ho1_2012 %>%
  create_hcode(2012) %>%
  mutate(h_code10 = str_c(add_zero(tinh2010, 2),
                          add_zero(huyen2010, 3),
                          add_zero(xa2010, 5),
                          add_zero(diaban2010, 3),
                          add_zero(hoso2010, 3))) -> ho1_2012

ho1_2010 %>%
  create_hcode(2010) -> ho1_2010
Removing duplicates observations
I’ve noticed there are duplicated observations in the datasets. Let’s remove those.
remove_duplicates <- function(df) {
  # Count the number of rows before removing duplicates
  original_rows <- nrow(df)

  # Remove duplicates
  df_unique <- df[!duplicated(df), ]

  # Count the number of rows after removing duplicates
  new_rows <- nrow(df_unique)

  # Print the number of rows dropped
  rows_dropped <- original_rows - new_rows
  cat("Number of duplicate rows in", deparse(substitute(df)), "dropped:", rows_dropped, "\n")

  # Return the data frame with duplicates removed
  return(df_unique)
}

remove_duplicates(ho1_2018) -> ho1_2018
Number of duplicate rows in ho1_2018 dropped: 165 remove_duplicates(ho1_2016) -> ho1_2016Number of duplicate rows in ho1_2016 dropped: 0 remove_duplicates(ho1_2014) -> ho1_2014Number of duplicate rows in ho1_2014 dropped: 0 remove_duplicates(ho1_2012) -> ho1_2012Number of duplicate rows in ho1_2012 dropped: 0 remove_duplicates(ho1_2010) -> ho1_2010Number of duplicate rows in ho1_2010 dropped: 0 Get the common h_codes
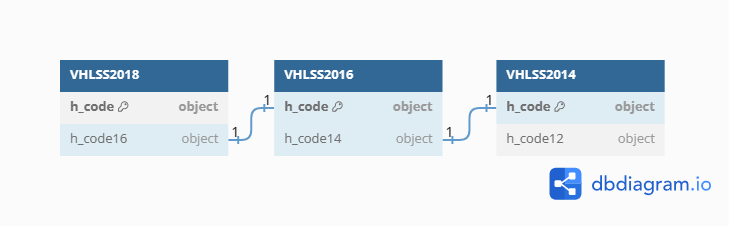
For each year, we have 2 variables h_code and h_code* (corresponding h_code of that household in the previous year). In order to create a panel dataset, we use the h_code* of a dataset to match with the h_code of the dataset from previous year.
For example, to join VHLSS 2018 & 2016, we use inner_join by h_code16 in VHLSS2018 = h_code in VHLSS2016.
get_common_code <- function(df1, df2, h_code_prev) {
  df1 %>%
    select(all_of(c("h_code", h_code_prev))) -> code_df1
  df2 %>%
    select(all_of(c("h_code"))) -> code_df2

  join_vector <- c("h_code")
  names(join_vector) <- h_code_prev

  code_df1 %>%
    inner_join(code_df2, by = join_vector, keep=FALSE) %>%
    pull(h_code) %>%
    return()
}

common_code1816 <- get_common_code(ho1_2018, ho1_2016, "h_code16")
common_code1614 <- get_common_code(ho1_2016, ho1_2014, "h_code14")
common_code1412 <- get_common_code(ho1_2014, ho1_2012, "h_code12")
common_code1210 <- get_common_code(ho1_2012, ho1_2010, "h_code10")
Importing .dta files and creating h_code variable
read_dta("./VHLSS2018/HO3.dta") %>%
  create_hcode(2018) -> ho3_2018
read_dta("./VHLSS2016/Ho3.dta") %>%
  create_hcode(2016) -> ho3_2016
read_dta("./VHLSS2014/Ho3.dta") %>%
  create_hcode(2014) -> ho3_2014
read_dta("./VHLSS2012/ho13.dta") %>%
  create_hcode(2012) -> ho3_2012
read_dta("./VHLSS2010/ho13.dta") %>%
  create_hcode(2010) -> ho3_2010
Construct panel_data
# Select variables for analysis:
var_list <- c("h_code", "thunhap", "thubq", "year")

# Subsetting the datasets:
ho3_2018 %>%
  filter(h_code %in% common_code1816) %>%
  select(all_of(var_list)) -> ho3_2018_mini

ho3_2016 %>%
  filter(h_code %in% common_code1816 | h_code %in% common_code1614) %>%
  select(all_of(var_list)) -> ho3_2016_mini

ho3_2014 %>%
  filter(h_code %in% common_code1614 | h_code %in% common_code1412) %>%
  select(all_of(var_list)) -> ho3_2014_mini

ho3_2012 %>%
  filter(h_code %in% common_code1412 | h_code %in% common_code1210) %>%
  select(all_of(var_list)) -> ho3_2012_mini

ho3_2010 %>%
  filter(h_code %in% common_code1210) %>%
  select(all_of(var_list)) -> ho3_2010_mini

# Join the datasets:
bind_rows(ho3_2018_mini, ho3_2016_mini, ho3_2014_mini, ho3_2012_mini, ho3_2010_mini) -> pdata
remove(ho3_2018_mini, ho3_2016_mini, ho3_2014_mini, ho3_2012_mini, ho3_2010_mini)
Print Panel data
pdata %>%
  paged_table()
Figure 3. Panel data
pdata %>%
  count(year) %>%
  paged_table()
Figure 4. Unbalanced panel data
Acknowledgements
I extend my gratitude to Dr. Ha Thi Cam Van for introducing the Vietnam Household Living Standards Survey dataset to me and help me initiated this project. Special thanks to Mr. Nguyen Chi Dung for his insightful work on Prepare Panel Data for Econometric Analysis from VHLSS. His work served as an invaluable resource, guiding and enlightening my approach to data analysis in R.